
INTRODUCTION
The primary function of the respiratory system is to oxygenate blood and eliminate carbon dioxide, which requires that blood come into virtual contact with fresh air to facilitate diffusion of respiratory gases between blood and gas. This process occurs in the lung alveoli, where blood flowing through alveolar wall capillaries is separated from alveolar gas by an extremely thin membrane of flattened endothelial and epithelial cells, across which respiratory gases diffuse and equilibrate. Blood flow through the lung is unidirectional via a continuous vascular path, along which venous blood absorbs oxygen from and loses CO2 to inspired gas. The path for airflow, in contrast, reaches a dead end at the alveolar walls; as such, the alveolar space must be ventilated tidally, with inflow of fresh gas and outflow of alveolar gas alternating periodically at the respiratory rate (RR). To achieve an enormous alveolar surface area (typically 70 m2) for blood-gas diffusion within the modest volume of a thoracic cavity (typically 7 L), nature has distributed both blood flow and ventilation among millions of tiny alveoli through multigenerational branching of both pulmonary arteries and bronchial airways. As a consequence of variations in tube lengths and calibers along these pathways, and of the effects of gravity, tidal pressure fluctuations, and anatomic constraints from the chest wall, there is variation among alveoli in their relative ventilations and perfusions. Not surprisingly, for the lung to be most efficient in exchanging gas, the fresh gas ventilation of a given alveolus must be matched to its perfusion.
For the respiratory system to succeed in oxygenating blood and eliminating carbon dioxide, it must be able to ventilate the lung tidally to freshen alveolar gas; it must provide for perfusion of the individual alveolus in a manner proportional to its ventilation; and it must allow for adequate diffusion of respiratory gases between alveolar gas and capillary blood. Furthermore, it must be able to accommodate severalfold increases in the demand for oxygen uptake or CO2 elimination imposed by metabolic needs or acid-base derangement. Given these multiple requirements for normal operation, it is not surprising that many diseases disturb respiratory function. Here, we consider in greater detail the physiologic determinants of lung ventilation and perfusion, and how their matching distributions and rapid gas diffusion allow for normal gas exchange. We also discuss how common diseases derange these normal functions, and thereby impair gas exchange—or at least raise the work of the respiratory muscles or heart to maintain adequate respiratory function.
VENTILATION
It is useful to think about the respiratory system as having three independently functioning components—the lung including its airways, the neuromuscular system, and the chest wall; the latter includes everything that is not lung or active neuromuscular system. As such, the mass of the respiratory muscles is part of the chest wall, while the force they generate is part of the neuromuscular system; the abdomen (especially an obese abdomen) and the heart (especially an enlarged heart) are, for these purposes, part of the chest wall. Each of these three components has mechanical properties that relate to its enclosed volume, or in the case of the neuromuscular system, the respiratory system volume at which it is operating, and to the rate of change of its volume (i.e., flow).
Volume-Related Mechanical Properties-Statics
Figure A-1 shows the volume-related properties of each component of the respiratory system. Due both to surface tension at the air-liquid interface between alveolar wall lining fluid and alveolar gas and to elastic recoil of the lung tissue itself, the lung requires a positive transmural pressure difference between alveolar gas and its pleural surface to stay inflated; this difference is called the elastic recoil pressure of the lung, and it increases with lung volume. Importantly, the lung becomes rather stiff at high lung volumes, so that relatively small volume changes are accompanied by large changes in transpulmonary pressure; in contrast, the lung is compliant at lower lung volumes, including those at which tidal breathing normally occurs. Note that at zero inflation pressure, even normal lungs retain some air in the alveoli. This occurs because the small peripheral airways of the lung are tethered open by radially outward pull from inflated lung parenchyma attached to adventitia; as the lung deflates during exhalation, those small airways are pulled open progressively less, and eventually they close, trapping some gas in the alveoli. This effect can be exaggerated with age and especially with obstructive airways diseases, resulting in gas trapping at quite large lung volumes.
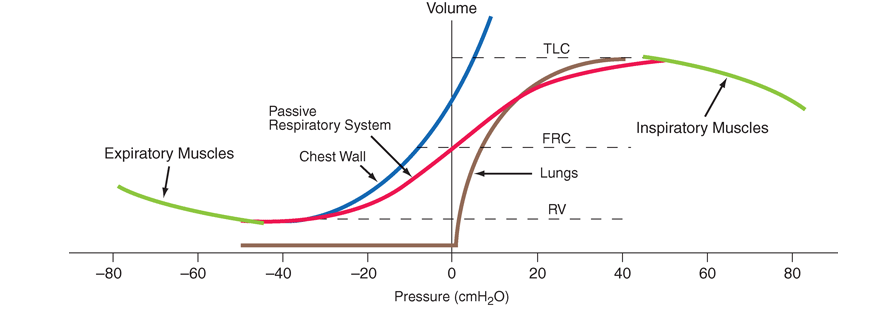
The elastic behavior of the passive chest wall (i.e., in the absence of neuromuscular activation) differs markedly from that of the lung. Whereas the lung tends toward full deflation with no distending (transmural) pressure, the chest wall encloses a large volume when pleural pressure equals body surface (atmospheric) pressure. Furthermore, the chest wall is compliant at high enclosed volumes, readily expanding even further in response to increases in transmural pressure. The chest wall also remains compliant at small negative transmural pressures (i.e., when pleural pressure falls slightly below atmospheric pressure), but as the volume enclosed by the chest wall becomes quite small in response to large negative transmural pressures, the passive chest wall becomes stiff due to squeezing together of ribs and intercostal muscles, diaphragm stretch, displacement of abdominal contents, and straining of ligaments and bony articulations. Under normal circumstances, the lung and the passive chest wall enclose essentially the same volume, the only difference between these being the volumes of the pleural fluid and of the lung parenchyma (both quite small). As such, and because the lung and chest wall function in mechanical series, the pressure required to displace the passive respiratory system (lungs + chest wall) at any volume is simply the sum of the elastic recoil pressure of the lungs and the transmural pressure across the chest wall. When plotted against respiratory system volume, this relationship assumes a sigmoid shape, exhibiting stiffness at high lung volumes (imparted by the lung), stiffness at low lung volumes (imparted by the chest wall, or sometimes by airway closure), and compliance in the middle range of lung volumes. There is also a passive resting point of the respiratory system, attained when alveolar gas pressure equals body surface pressure (i.e., the transrespiratory system pressure is zero). At this volume [called functional residual capacity (FRC)], the outward recoil of the chest wall is balanced exactly by the inward recoil of the lung. As these recoils are transmitted through the pleural fluid, the latter is pulled both outward and inward simultaneously at FRC, and, thus, its pressure falls below atmospheric pressure (typically, –5 cmH2O).
The normal passive respiratory system would equilibrate at FRC and remain there were it not for the actions of respiratory muscles. The inspiratory muscles act on the chest wall to generate the equivalent of positive pressure across the lungs and passive chest wall, while the expiratory muscles generate the equivalent of negative transrespiratory pressure. The maximal pressures these sets of muscles can generate varies with the lung volume at which they operate, due to length-tension relationships in striated muscle sarcomeres and to changes in mechanical advantage as the angles of insertion change with lung volume (Fig. A-1). Nonetheless, under normal conditions the respiratory muscles are substantially “overpowered” for their roles, and generate more than adequate force to drive the respiratory system to its stiffness extremes, as determined by the lung [total lung capacity (TLC)] or chest wall or airway closure [residual volume (RV)]; importantly, the latter always prevents the adult lung from emptying completely under normal circumstances. The excursion between full and minimal lung inflation is called vital capacity (VC; Fig. A-2), and is readily seen to be the difference between volumes at two unrelated stiffness extremes—one determined by the lung (TLC) and the other determined by the chest wall or airways (RV). Thus, although VC is easy to measure (see below), it tells one little about the intrinsic properties of the respiratory system. It is much more useful, as we shall see, for the clinician to know TLC and RV individually.
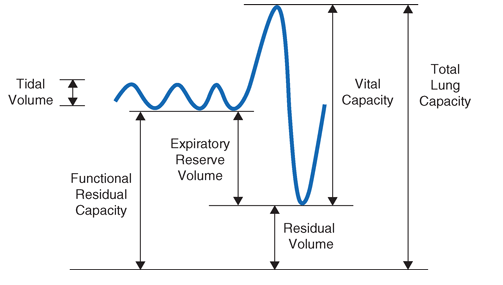
Fig. A-2 . Spirogram demonstrating a slow vital capacity maneuver and various lung volumes.
Flow-Related Mechanical Properties—Dynamics
The passive chest wall and active neuromuscular system do exhibit mechanical behaviors related to the rate of change of volume, but these become quantitatively important only at markedly supraphysiologic breathing frequencies (e.g., during high-frequency mechanical ventilation), and, thus, we shall not address these here. In contrast, the dynamic airflow properties of the lung substantially determine the ability to ventilate and contribute importantly to the work of breathing, and are often deranged by disease. Understanding these properties is, therefore, well worthwhile.
As with flow of any fluid (gas or liquid) in any tube, maintenance of airflow within the pulmonary airways requires a pressure gradient that falls along the direction of flow, the magnitude of which is determined by the flow rate and the frictional resistance to flow. During quiet tidal breathing, the pressure gradients driving inspiratory or expiratory flow are small owing to the very low frictional resistance of normal pulmonary airways (normally <2 cmH2O/L per second). However, during rapid exhalation another phenomenon reduces flow below that which would have been expected were frictional resistance the only impediment to flow. This phenomenon is called dynamic airflow limitation, and it occurs because the bronchial airways through which air is exhaled are collapsible rather than rigid (Fig. A-3). An important anatomic feature of the pulmonary airways is its treelike branching structure. While the individual airways in each successive generation, from most proximal (trachea) to most distal (respiratory bronchioles), are smaller than those of the parent generation, their number increases exponentially such that the summed cross-sectional area of the airways becomes very large toward the lung periphery. Because flow (volume/time) is constant along the airway tree, the velocity of airflow (flow/summed cross-sectional area) is much greater in the central airways than in the peripheral airways. During exhalation, gas leaving the alveoli must therefore gain velocity as it proceeds toward the mouth. The energy required for this “convective” acceleration is drawn from the component of gas energy manifested as its local pressure, thereby reducing intraluminal gas pressure (the Bernoulli effect), reducing airway transmural pressure, reducing airway size (Fig. A-3), and reducing flow. If one tries to exhale more forcefully, the local velocity increases further and reduces airway size further, resulting in no net increase in flow. Under these circumstances, flow has reached its maximum possible value, or its flow limit. Lungs normally exhibit such dynamic airflow limitation. The maximum value of flow is related to the gas density, airway cross-section and distensibility, the elastic recoil pressure of the lung, and the frictional pressure loss to the flow-limiting airway site. Under normal conditions, maximal expiratory flow falls with lung volume (Fig. A-4), due primarily to the dependence of lung recoil pressure on lung volume (Fig. A-1). In pulmonary fibrosis, lung recoil pressure is increased at any lung volume, and, thus, the maximum expiratory flow is relatively elevated when considered in relation to lung volume. Conversely, in emphysema, lung recoil pressure is reduced, which is a principal mechanism by which maximal expiratory flows fall. Diseases that narrow the airway lumen at any transmural pressure, such as asthma or chronic bronchitis, or which cause excessive airway collapsibility, like tracheomalacia, also reduce maximal expiratory flow.

Fig. A-3. Luminal area versus transmural pressure relationship. Transmural pressure represents the pressure difference across the airway wall from inside to outside.


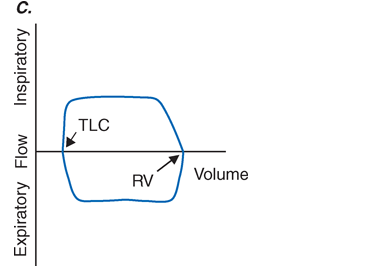
Fig. A-4. Flow-volume loops. A. Normal. B. Airflow obstruction. C. Fixed central airway obstruction. RV, residual volume; TLC, total lung capacity.
The Bernoulli effect also acts during inspiration, but the more negative pleural pressures during inspiration lower the pressure outside of airways, thereby increasing transmural pressure and promoting airway expansion. Thus, inspiratory airflow limitation seldom occurs due to diffuse pulmonary airway disease. Conversely, extrathoracic airway narrowing (as due to a tracheal adenoma or post-tracheostomy stricture) can lead to inspiratory airflow limitation (Fig. A-4).
The phenomenon of flow limitation and the importance of airway size and distensibility and of upstream pressure (lung elastic recoil pressure for forced exhalation) can easily be appreciated by sniffing through one’s nose with low, medium, or substantial effort. If one keeps the nostrils relaxed, increasing from low to medium inspiratory effort raises inspiratory flow through the nose somewhat, but inhaling even harder will likely not increase inspiratory nasal airflow more but, rather, will just collapse the nares, a manifestation of dynamic airflow limitation. One can increase inspiratory nasal airflow, however, by flaring one’s nostrils using the alae nasi muscles. This increases nostril area (reducing velocity for a given flow through the nares) and stiffens the nostril walls (reducing their narrowing in response to negative transmural pressure). Springlike nasal strips sometimes used by football players have the same effect. In patients with obstructive sleep apnea (OSA), a narrowed and excessively compliant pharyngeal airway also collapses in response to negative transmural pressure generated by the Bernoulli effect and by inspiratory frictional pressure loss in the nose (which is why an upper respiratory infection often worsens OSA). Increasing the upstream driving pressure from which these phenomena lower intrapharyngeal gas pressure with positive nasal airway pressure keeps pharyngeal transmural pressure positive, preventing inspiratory airflow limitation. Inspiratory airflow limitation in the nose or in the pharynx of patients with OSA closely parallels expiratory flow limitation in the lung.
Work of Breathing
In health, the elastic (volume change–related) and dynamic (flow-related) loads that must be overcome to ventilate the lungs at rest are small, and the work required of the respiratory muscles is minimal. However, the work of breathing can increase considerably, due either to requirement for substantially increased ventilation, an abnormally increased mechanical load, or both. As discussed below, the rate of ventilation is primarily set by the need to eliminate carbon dioxide, and, thus, ventilation increases during exercise (sometimes more than 20-fold) and during metabolic acidosis as a compensatory response. Naturally, the work rate required to overcome the elasticity of the respiratory system increases with both the depth and frequency of tidal breaths, while the work required to overcome the dynamic load increases with total ventilation. A modest increase of ventilation is most efficiently achieved by increasing tidal volume but not respiratory rate, which is the normal ventilatory response to lower level exercise. At high levels of exercise, deep breathing persists, but respiratory rate also increases. The pattern chosen by the respiratory controller minimizes the work of breathing.
Work of breathing also increases when disease reduces the compliance of the respiratory system or increases the resistance to airflow. The former occurs commonly in diseases of the lung parenchyma (interstitial processes or fibrosis, alveolar filling diseases such as pulmonary edema or pneumonia, or substantial lung resection), and the latter occurs in obstructive airways diseases such as asthma, chronic bronchitis, emphysema, and cystic fibrosis. Furthermore, severe airflow obstruction can functionally reduce the compliance of the respiratory system by leading to dynamic hyperinflation. In this scenario, expiratory flows slowed by the obstructive airways disease may be insufficient to allow for complete exhalation during the expiratory phase of tidal breathing; as a result, the “functional residual capacity” from which the next breath is inhaled is greater than the static FRC. With repetition of incomplete exhalations of each tidal breath, the operating FRC becomes dynamically elevated, sometimes to a level that approaches TLC. At these high lung volumes, the respiratory system is much less compliant than at normal breathing volumes, and, thus, the elastic work of each tidal breath is also increased. The dynamic pulmonary hyperinflation that accompanies severe airflow obstruction causes patients to sense difficulty in breathing in—even though the pathophysiologic abnormality at root cause is expiratory airflow obstruction.
Adequacy of Ventilation
As noted above, the respiratory control system that sets the rate of ventilation responds to chemical signals, including arterial carbon dioxide and oxygen tensions and blood pH, and to volitional needs, such as the need to inhale deeply before playing a long phrase on the trumpet. Here, we focus on the relationship between ventilation of the lung and carbon dioxide elimination.
At the end of each tidal exhalation, the conducting airways are filled with alveolar gas that had not reached the mouth when expiratory flow stopped. During the ensuing inhalation, fresh gas immediately enters the airway tree at the mouth, but the gas first entering the alveoli at the start of inhalation is that same alveolar gas in the conducting airways that had just left the alveoli. As such, fresh gas does not enter the alveoli until the volume of the conducting airways has been inspired. This volume is called the anatomic dead space. Quiet breathing with tidal volumes smaller than the anatomic dead space introduces no fresh gas into the alveoli at all; only that part of the inspired tidal volume (VT) that is greater than the dead space (VD) introduces fresh gas into the alveoli. Importantly, the dead space can be further increased functionally if some of the inspired tidal volume is delivered to a part of the lung that receives no pulmonary blood flow, and, thus, cannot contribute to gas exchange, as can occur in the portion of the lung distal to a large pulmonary embolus. As such, exhaled minute ventilation (VE=VT x RR) includes a component of dead space ventilation (VD=VD x RR) and a component of fresh gas alveolar ventilation (VA=[VT-VD] x RR) Carbon dioxide elimination from the alveoli is equal to VA times the difference in CO2 fraction between inspired air (essentially zero) and alveolar gas (typically ~5.6%, after correcting for humidification of inspired air, corresponding to 40 mmHg). In the steady state, the alveolar fraction of CO2 is equal to the metabolic CO2 production divided by the alveolar ventilation. Because, as discussed below, alveolar and arterial CO2 tensions are equal, and because the respiratory controller normally strives to maintain arterial PCO2 (PaCO2) at ~40 mmHg, the adequacy of alveolar ventilation is reflected in PaCO2. If PaCO2 falls much below 40 mmHg, alveolar hyperventilation is present, and if PaCO2 exceeds 40 mmHg, then alveolar hypoventilation is present. Ventilatory failure is characterized by extreme alveolar hypoventilation.
As a consequence of oxygen uptake of alveolar gas into capillary blood, alveolar oxygen tension falls below that of inspired gas. The rate of oxygen uptake (determined by the body’s metabolic oxygen consumption) is related to the average rate of metabolic carbon dioxide production and their ratio, called the “respiratory quotient” (R=Vco2/Vo2), depends largely on the fuel being metabolized. For a typical A merican diet, R is usually around 0.85, and more oxygen is absorbed than CO2 is excreted. Together, these phenomena allow the estimation of alveolar oxygen tension, according to the following relationship, known as the alveolar gas equation:
PaO2 = FIO2 x (Pbar – PH2O) – PaCO2/R
The alveolar gas equation also highlights the influences of inspired oxygen fraction (FIO2), barometric pressure (Pbar), and vapor pressure of water (PH2O = 47 mmHg at 37°C) in addition to alveolar ventilation (which sets PACO2) in determining PAO2. An implication of the alveolar gas equation is that severe arterial hypoxemia rarely occurs as a pure consequence of alveolar hypoventilation at sea level while breathing air. The potential for alveolar hypoventilation to induce severe hypoxemia with otherwise normal lungs increases as Pbar falls with increasing altitude.
Gas Exchange
Diffusion
For oxygen to be delivered to the peripheral tissues, it must pass from alveolar gas into alveolar capillary blood by diffusing through alveolar membrane. The aggregate alveolar membrane is highly optimized for this process, with a very large surface area and minimal thickness. Diffusion through the alveolar membrane is so efficient in the human lung that in most circumstances its hemoglobin becomes fully oxygen saturated by the time a red blood cell has traveled just one-third the length of the alveolar capillary. As such, uptake of alveolar oxygen is ordinarily limited by the amount of blood transiting the alveolar capillaries rather than how rapidly oxygen can diffuse across the membrane; thus, oxygen uptake from the lung is said to be “perfusion limited.” Carbon dioxide also equilibrates rapidly across the alveolar membrane. Thus, the oxygen and CO2 tensions in capillary blood leaving a normal alveolus are essentially equal to those in alveolar gas. In only rare circumstances is oxygen uptake from normal lungs diffusion-limited, which can occur at high altitude and/or by high-performance athletes exerting maximum effort. Diffusion limitation can also occur in interstitial lung disease if substantially thickened alveolar walls remain perfused.
Ventilation-Perfusion Heterogeneity
As noted above, for gas exchange to be most efficient, the ventilation to each individual alveolus should be matched to the perfusion to its accompanying capillaries for each of millions of alveoli. Due to the differential effects of gravity on lung mechanics and blood flow throughout the lung, and due to differences of airway and vascular architecture among various respiratory paths, there is minor ventilation/perfusion heterogeneity even in the normal lung; however, V/Q heterogeneity can be particularly marked in disease. Two extreme examples are (1) ventilation of unperfused lung distal to a pulmonary embolus, in which ventilation of the physiologic dead space is “wasted” in the sense that it does not contribute to gas exchange; and (2) perfusion of nonventilated lung, a condition known as a “shunt.” The latter allows venous blood to pass through the lung unaltered; when mixed with fully oxygenated blood leaving other well-ventilated lung units, shunted venous blood disproportionately lowers the mixed arterial PaO2, due to the nonlinear oxygen content versus the PO2 relationship of hemoglobin (Fig. A-5). Furthermore, the resulting arterial hypoxemia is refractory to supplemental inspired oxygen. This is because raising inspired FIO2 has no effect on alveolar gas tensions in nonventilated alveoli, and while raising inspired FIO2 does increase PAO2 in ventilated alveoli, the oxygen content of blood exiting ventilated units increases only slightly as hemoglobin will already have been nearly fully saturated and the solubility of oxygen in plasma is quite small.
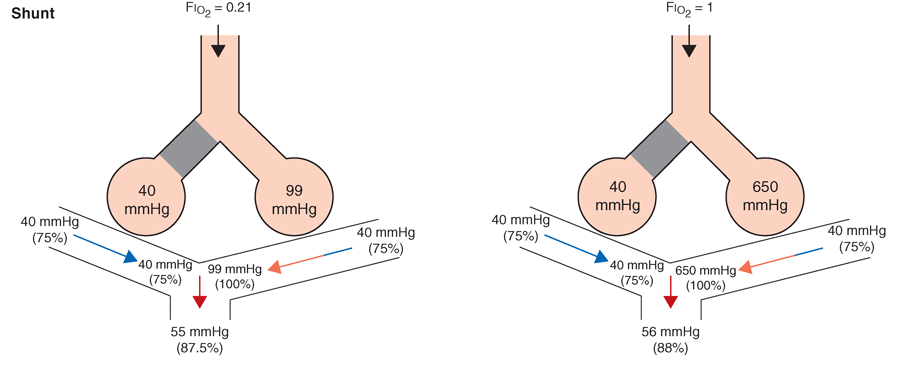
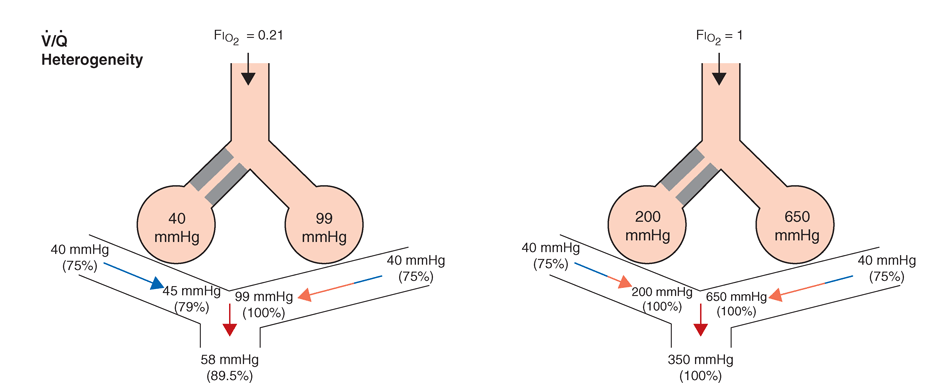
Fig. A-5. Influence of air vs oxygen breathing on mixed arterial oxygenation in shunt and ventilation/perfusion heterogeneity. Partial pressure of oxygen (mmHg) and oxygen saturations are shown for mixed venous blood, end capillary blood for normal versus affected alveoli, and for mixed arterial blood.
More commonly occurring than the two extreme examples given above is a widening of the distribution of ventilation/ perfusion ratios; such V/Q heterogeneity is a common consequence of lung disease. In this circumstance, perfusion of relatively underventilated alveoli results in the incomplete oxygenation of exiting blood. When mixed with well-oxygenated blood leaving higher V/Q regions, this partially preoxygenated blood disproportionately lowers arterial PaO2, although to a lower extent than does a similar perfusion fraction of blood leaving regions of pure shunt. In addition, in contrast to shunt regions, inhalation of supplemental oxygen does raise the PAO2 even in relatively underventilated low V/Q regions, and so the arterial hypoxemia induced by V/Q heterogeneity is typically responsive to oxygen therapy (Fig. A-5).
In sum, arterial hypoxemia can be caused by substantial reduction of inspired oxygen tension, by severe alveolar hypoventilation, or by perfusion of relatively underventilated (low V/Q) or completely unventilated (shunt) lung regions, and, in unusual circumstances, by limitation of gas diffusion.
Approach to the Patient: Disturbances of Respiratory Function
There are many diseases that injure the respiratory system, but there are relatively few ways in which it responds to that injury. For this reason, the pattern of physiologic abnormalities may or may not provide sufficient information to discriminate among conditions. The following studies are commonly used to characterize a patient’s respiratory function and often lead to a better understanding of the underlying disorder.
Measurement of Ventilatory Function
Lung Volumes
Figure A-2 demonstrates a spirometry tracing in which the volume of air entering or exiting the lung is plotted over time. In a slow vital capacity maneuver, the subject inhales from FRC, fully inflating the lungs to TLC, and then the patient exhales slowly to RV; VC is the difference between TLC and RV, and represents the maximum excursion of the respiratory system. Spirometry discloses relative volume changes during these maneuvers, but cannot reveal the absolute volumes at which they occur. To determine absolute lung volumes, two approaches are commonly used—inert gas dilution and body plethysmography. In the former, a known amount of a nonabsorbable inert gas (usually helium or neon) is inhaled in a single large breath or is rebreathed from a closed circuit; the inert gas is diluted by the gas resident in the lung at the time of inhalation, and its final concentration reveals the volume of resident gas contributing to the dilution. A drawback of this method is that regions of the lung that ventilate poorly (e.g., due to airflow obstruction) may not receive much inspired inert gas and so do not contribute to its dilution. As such, inert gas dilution often underestimates true lung volumes.
In the second approach, FRC is determined by measuring the compressibility of gas within the chest, which is proportional to the volume of gas being compressed. The patient sits in a body plethysmograph, a chamber usually made of transparent plastic to minimize claustrophobia, and at the end of a normal tidal breath (i.e., when lung volume is FRC) is instructed to pant against a closed shutter, thus, periodically compressing air within the lung slightly. Pressure fluctuations at the mouth and volume fluctuations within the body box (equal but opposite to those of the chest) are measured, and from these the thoracic gas volume is calculated using Boyle’s law. Once FRC is obtained, TLC and RV are calculated by adding the inspiratory capacity or subtracting expiratory reserve volume, respectively, values determined during spirometry (Fig. A-2). The most important determinants of healthy individuals’ lung volumes are height, age, and gender, but there is considerable additional normal variation beyond that accounted for by these parameters. In addition, race influences lung volumes; on average TLC values are about 12% smaller in African Americans and 6% smaller in Asian Americans when compared with those of white Americans. In practice, a mean “normal” value is predicted by multivariate regression equations using height, age, and gender, and the patient’s value is divided by the predicted value (often with “race correction” applied) to determine “percent predicted.” For most measures of lung function, 85–115% of the predicted value can be normal, but in health the various lung volumes tend to scale together. For example, if one is “normal big” with TLC 110% of the predicted value, then all other lung volumes and spirometry values will also approximate 110% of their respective predicted values. This pattern is particularly helpful in evaluating airflow, as discussed below.
Air Flow
As noted above, spirometry plays a key role in lung volume determination. But even more often, spirometry is used to measure air flow, which reflects the dynamic properties of the lung. During a forced vital capacity maneuver, the patient inhales to TLC and then exhales rapidly and forcefully to RV; this ensures that flow limitation has been achieved, so that the precise effort made has little influence on actual flow. The total amount of air exhaled is the forced vital capacity (FVC) and the amount of air exhaled in the first second is the forced expiratory volume in one second (FEV1); note that FEV1 is a flow rate, as it reveals volume change per time. As with lung volumes, an individual’s maximal expiratory flows should be compared to predicted values based on height, age, and gender. While the FEV1/FVC ratio is typically reduced in airflow obstruction, airflow obstruction can also reduce FVC by raising RV. If this occurs, the FEV1/FVC ratio may be “artifactually normal,” erroneously suggesting that airflow obstruction is absent. To circumvent this problem, it is useful to compare FEV1 as a fraction of its predicted value with TLC as a fraction of its predicted value. In health, these are usually similar. In contrast, even an FEV1 value that is 95% of its predicted value may actually be relatively low if TLC is 110% of its respective prediction. In this case, airflow obstruction might be present, despite the “normal” value for FEV1.
The relationships among volume, flow, and time during spirometry are best displayed in two plots—the spirogram (volume vs. time) and the flow-volume loop (flow vs. volume) (Fig. A-4). In conditions that cause airflow obstruction, the site of obstruction can sometimes be correlated with the shape of the flow-volume loop. In diseases that cause lower airway obstruction such as asthma or emphysema, flows decrease more rapidly with declining lung volumes leading to a characteristic scooping of the flow-volume loop. In contrast, fixed upper airway obstruction typically leads to inspiratory and/or expiratory flow plateaus (Fig. A-4).
Airways Resistance
The total resistance of the pulmonary and upper airways is measured in the same body plethysmography used to measure FRC. The patient is asked once again to pant, but this time against a closed and then opened shutter. Panting against the closed shutter reveals the thoracic gas volume as above. When the shutter is opened, flow is now directed to and from the body box, so that volume fluctuations in the box reveal the extent of thoracic gas compression, which in turn reveals the pressure fluctuations driving flow. Flow is measured simultaneously, allowing the calculation of lung resistance (as flow divided by pressure). In health, airways resistance is very small, <2 cmH2O/L per second, and half of this resides within the upper airway. Of the lung’s contribution, most of the resistance originates in the central airways. For this reason, airways resistance measurement tends to be insensitive to peripheral airflow obstruction.
Respiratory Muscle Strength
To measure respiratory muscle strength, the patient is instructed to exhale or inhale with maximum effort against a closed shutter while pressure is monitored at the mouth. Pressures greater than ±60 cmH2O at FRC are considered adequate, making unlikely the possibility that respiratory muscle weakness accounts for any other ventilatory dysfunction that might be identified.
Measurement of Gas Exchange
Diffusing Capacity
This test uses a small (and safe) amount of carbon monoxide to measure gas exchange across the alveolar membrane during a 10-second breath hold. Carbon monoxide in exhaled breath is analyzed to determine the quantity of CO absorbed by crossing the alveolar membrane and combining with hemoglobin in red blood cells. This “single-breath diffusing capacity” [diffusion capacity of the lung for carbon monoxide (DLCO)] value increases with the surface area available for diffusion and the amount of hemoglobin within the capillaries, and varies inversely with alveolar membrane thickness. Thus, DLCO decreases in diseases that thicken or destroy alveolar membranes (e.g., pulmonary fibrosis, emphysema), curtail the pulmonary vasculature (e.g., pulmonary hypertension), or reduce alveolar capillary hemoglobin (e.g., anemia). Single-breath diffusing capacity may be elevated in acute congestive heart failure, asthma, polycythemia, and pulmonary hemorrhage.
Arterial Blood Gases
The effectiveness of gas exchange can be assessed by measuring the partial pressures of oxygen and carbon dioxide in a sample of blood obtained by arterial puncture. The oxygen content of blood (CaO2) depends upon arterial saturation (%O2Sat), which is set by PaO2, pH, and PaCO2 according to the oxyhemoglobin dissociation curve; CaO2 can also be measured by oximetry (see below):
CaO2 (mL/dL = 1.34 (mL/dL/g) x [hemoglobin](g) x%O2Sat + 0.003 (mL/dL/mmHg) x PaO2 (mmHg)
Pulse Oximetry
Continuous monitoring of arterial blood gases requires either repeated arterial punctures or an indwelling arterial catheter, and so may be difficult in many circumstances. Instead, the oxygen saturation fraction of hemoglobin can be measured continuously using pulse oximetry, a tool that measures the absorbance by hemoglobin of several wavelengths of light transmitted across a finger, toe, or ear by a noninvasive probe. However, since oxygen content varies relatively little with PaO2 at saturations above 90%, it is difficult to know the precise PaO2 using this device. In addition, as noted above, PaCO2 is needed to fully assess the mechanism of hypoxemia, a value that is not revealed by pulse oximetry.
Clinical Correlations: Typical Examples
This chapter has highlighted the physiologic processes underlying respiratory system function and the techniques used by clinicians to assess them. Figure A-6 lists abnormalities in pulmonary function testing typically found in a number of common respiratory disorders and highlights the simultaneous occurrence of multiple physiologic abnormalities. Importantly, some of these respiratory disorders can coexist, which results in more complex superposition of these abnormalities.
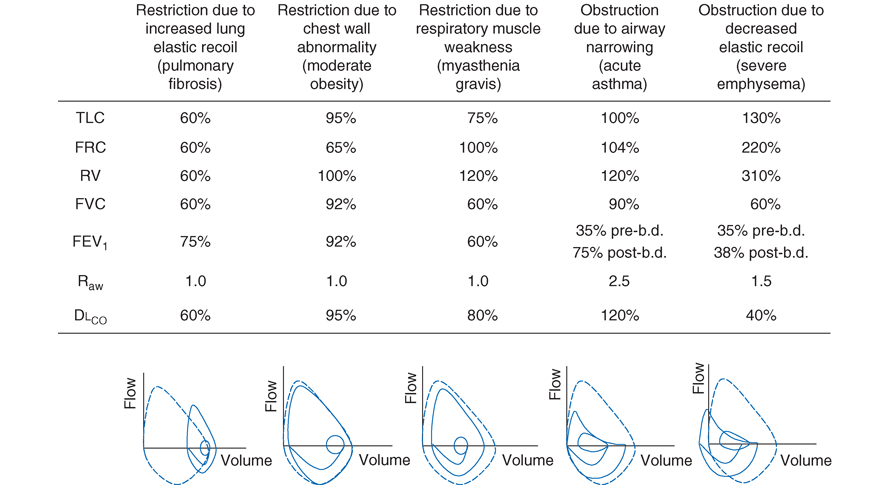
Ventilatory Restriction Due to Increased Elastic Recoil-Example: Idiopathic Pulmonary Fibrosis
Idiopathic pulmonary fibrosis raises lung recoil at all lung volumes, thereby lowering TLC, FRC, and RV, as well as FVC. Maximal expiratory flows are also reduced compared with normal values, but are relatively elevated when considered in relation to lung volumes. The latter occurs both because the increased lung recoil drives greater maximal flow at any lung volume and because airway diameters are relatively increased due to greater radially outward traction exerted on bronchi by the stiff lung parenchyma. Airway resistance is also normal, for the same reason. Pulmonary capillaries are destroyed by the fibrotic process resulting in marked reduction in diffusing capacity. Oxygenation is often severely reduced due to persistent perfusion of alveolar units that are relatively underventilated due to fibrosis of nearby (and mechanically linked) lung. The flow-volume loop looks like a miniature version of a normal loop but is shifted toward lower absolute lung volumes and displays maximum expiratory flows that are increased for any given volume when compared to the normal tracing.
Ventilatory Restriction Due to Chest Wall Abnormality-Example: Moderate Obesity
As the size of the average American continues to increase, this pattern may become the most commonly seen of pulmonary function abnormalities. In moderate obesity, the outward recoil of the chest wall is blunted due to the weight of chest wall fat and to the space occupied by intraabdominal fat. As such, preserved inward recoil of the lung now overbalances the reduced outward recoil of the chest wall, and FRC falls. Because respiratory muscle strength and lung recoil remain normal, TLC is typically unchanged (although TLC may fall in massive obesity) and RV is normal (but may be reduced in massive obesity). Mild hypoxemia may be present, due to perfusion of alveolar units that are poorly ventilated because of airway closure that occurs in dependent portions of the lung while breathing near the reduced FRC. Flows remain normal, as does DLCO, unless obstructive sleep apnea (which often accompanies obesity) and associated chronic intermittent hypoxemia have induced pulmonary arterial hypertension, in which case DLCO may be low.
Ventilatory Restriction Due to Reduced Muscle Strength-Example: Myasthenia Gravis
FRC remains normal, as both lung recoil and passive chest wall recoil are normal. However, TLC is low and RV is elevated, as respiratory muscle strength is insufficient to push the passive respiratory system fully toward either volume extreme. Caught between the low TLC and the elevated RV, FVC and FEV1 are reduced as “innocent bystanders.” As airway size and the lung vasculature are unaffected, both airways resistance (Raw) and DLCO are normal. Oxygenation is normal unless weakness becomes so severe that the patient has insufficient strength to reopen collapsed alveoli during sighs, with resulting atelectasis.
Airflow Obstruction Due to Decreased Airway Diameter-Example: Acute Asthma
During an episode of acute asthma, luminal narrowing due to smooth muscle constriction and inflammation and thickening within the small- and medium-sized bronchi raise frictional resistance and reduce airflow. Scooping of the flow-volume loop is caused by reduction of airflow, especially at lower lung volumes. Often, airflow obstruction can be reversed by inhalation of B2 -adrenergic agonists acutely or by treatment with inhaled steroids chronically. Total lung capacity (TLC) usually remains normal (although elevated TLC is sometimes seen in long-standing asthma), but FRC may be dynamically elevated. RV is often increased due to exaggerated airway closure at low lung volumes, and this elevation of RV reduces FVC. Because central airways are narrowed, airways resistance is usually elevated. Mild arterial hypoxemia is often present due to perfusion of relatively underventilated alveoli distal to obstructed airways (and is responsive to oxygen supplementation), but DLCO is normal or mildly elevated.
Airflow Obstruction Due to Decreased Elastic Recoil-Example: Severe Emphysema
Loss of lung elastic recoil in severe emphysema results in pulmonary hyperinflation, of which elevated TLC is the hallmark. FRC is more severely elevated due both to loss of lung elastic recoil and to dynamic hyperinflation (the same phenomenon as autoPEEP, which is the unintended positive end-expiratory pressure). Residual volume is very severely elevated due to airway closure and because exhalation toward RV may take so long that RV cannot be reached before the patient must inhale again. Both FVC and FEV1 are markedly decreased, the former due to the severe elevation of RV, and the latter because loss of lung elastic recoil reduces the pressure driving maximal expiratory flow and also reduces tethering open of small intrapulmonary airways. The flow-volume loop demonstrates marked scooping of the flow-volume loop, with an initial transient spike of flow attributable largely to expulsion of air from collapsing central airways at the onset of forced exhalation. Otherwise, the central airways remain relatively unaffected, so Raw is normal in “pure” emphysema. Loss of alveolar surface and capillaries in the alveolar walls reduces DLCO, but because poorly ventilated emphysematous acini are also poorly perfused (due to loss of their capillaries), arterial hypoxemia is usually not seen at rest until emphysema becomes very severe. However, during exercise, PaO2 may fall precipitously if extensive destruction of the pulmonary vasculature prevents a sufficient increase in cardiac output and mixed venous oxygen content falls substantially. Under these circumstances, any venous admixture through low V/. Q units has a particularly marked effect in lowering mixed arterial oxygen tension.
 _U.S. Dollar
 _Nepali Rupees